31 Mar 2017

Brand new Sentinel.la plugins to control your entire stack


Sentinel.la is a fast way to manage OpenStack, helping you to reduce OpenStack’s learning curve.

Yes, we do love and specialize on OpenStack, but what happens if you need to do more? If you need help making easier your journey as a DevOps, Sysadmin, Developer or a person interested in getting different data about your server or application, well, we were thinking about it, how can we help you? And then the Plugins idea was born.

The plugins are components in python and with them, you can drop some lines of code with python logic (at this moment) to extract server metrics by processes/components. It’s also possible to monitor within a server and transform it into just one piece of data, for example, the number of volumes in a Docker deployment, Ceph health check, is MySQL server running?, etc.. this information will be displayed into the Sentinella App.

In this way, our users just only get and save the information related to their particular needs.


Sentinel.la is seeking not only into bringing you OpenStack, but to also be an efficient tool. We’ve seen OpenStack deployments that use different components like PostgreSQL, RabbitMQ, Apache, etc.. all that being required to be monitored, to get a faster and better troubleshooting.

This is the reason why now you can make your own plugins and share them with the community.


How do plugins work in Sentinel.la?

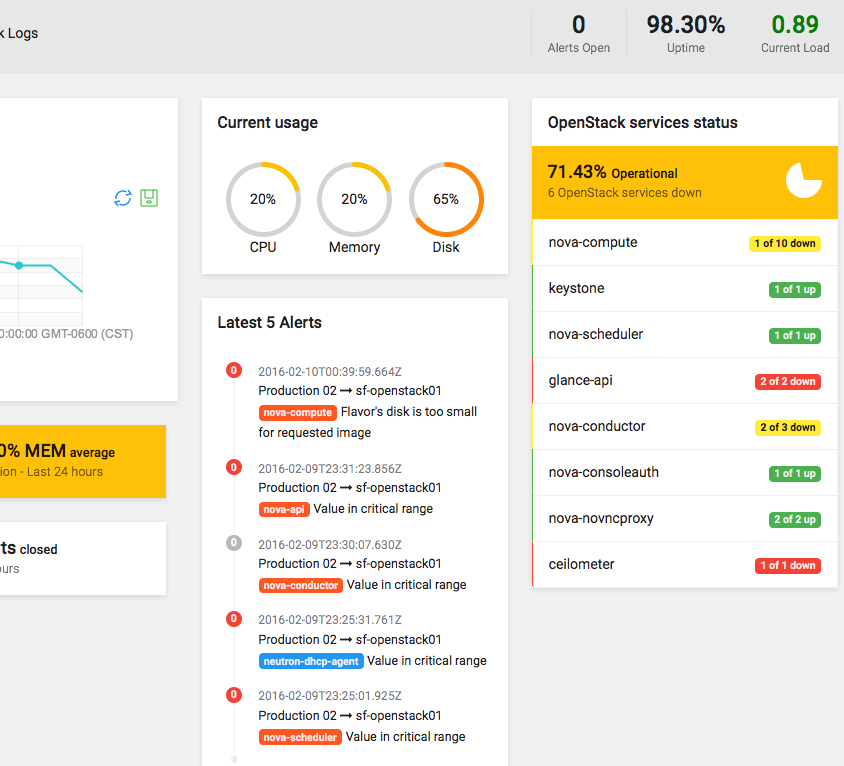
Sentinel.la takes your metrics and saves this information using our API, all through Sentinella Agent.

Our components are an abstract of the Sentinel.la functionality to adapt new features.


The plugin uses a task in Sentinella Agent to push new metrics and sends to Sentinella API, when arriving at Sentinella API will apply validation to know if is a valid plugin, the next diagram show you the internal workflow.


Sentinel.la has a process to plugin evaluation, this process starts when registering a plugin release.

Is necessary ensure that all Sentinel.la plugins follow the rules, to keep control and quality this is the reason why we have a process to approving but is simple.

  1. Register release.
  2. Evaluatión.
  3. Approve.

The point 2 consists in the review of code, check if the rules have been applied.

What steps do I need to follow to add my plugin into Sentinel.la?

1.- Register Plugin at Sentinella.
2.- Get your plugin_key.
3.- Download the plugin template.
4.- Put your code logic into your plugin, following the specs.
5.- Make a release.
6.- Install plugin into your server with the Sentinella Agent

For more information click here.

Also, you can take other plugins done by Sentinella Community.


What are the rules?

  1.  Plugins must register into Sentinel.la.
  2. Follow the documentation to make Sentinel.la Plugin.
  3. Enjoy.

How do I install a plugin?

Piece of cake:

$ sentinella install <plugin_name> <plugin_version>

How do I configure a plugin?

When the plugin is already installed, open this file /etc/sentinella/sentinella.conf this file has a configuration section for the plugins, it’s one object called plugins.
In this section, you must add your plugin.

Section example:

"plugins": {
        "sentinella.openstack_logs": [
            "get_openstack_events"
        ],
        "sentinella.metrics": [
            "get_server_usage_stats"
        ],
        "sentinella.test": [
            "get_stats"
        ],
        "sentinella.sentinella-docker": [ <----- Name of package
            "docker_stats" <----- Name method.
        ]
    },

If you have any questions about the package name, class name, etc.. you can go to /usr/share/python/sentinella/lib/python2.7/site-packages/sentinella/ here are all installed plugins.

Doubts?

Please, contact us 🙂

Share this
04 Nov 2016

How we built Sentinel.la (II) – AngularJS and Netlify

“Apollo” is the codename of our UI. It was built with AngularJS because we wanted a single-page application (SPA). This is how it looks like:

captura-de-pantalla-de-2016-11-03-12-51-01


AngularJS and Single-Page Apps.

An SPA ( Single-Page Apps) is a web application (or a website) that fits into a single page in order to give a more seamless experience to users, like a desktop application. Single Page Applications are becoming more popular for a good reason. SPAs can provide an experience that feels almost like a native app in the web, instead of sending a full page of markup, you can send a payload of data and then turn it into markup at the client side.

We decided to build an hybrid SPA. By hybrid I mean that, instead of treating the entire application as a single page application, we divide it into logical units of work or paths through the system. You end up with certain areas that result in a full page refresh, but the key interactions of a module take place in the same page without refreshing.  For example, administration might be one “mini” SPA app while configuration is another.

Another advantage of AngularJS is that it uses the MVC approach, which is familiar to developers who have used Django or another MVC web development framework. Angular implements MVC by asking you to split your app into MVC components, then Angular manages those components for you and also serves as the pipeline that connects them.

Another advantage is that it puts the DOM manipulations where they belong. Traditionally, the view modifies the DOM to present data and manipulates the DOM (or invokes jQuery) to add behavior. With Angular, DOM manipulation code should be inside directives and not in the view. Angular takes the view just as another HTML page with placeholders for data.

Every SPA needs an API to consume. We built an API with Flask, that I’ll be reviewing in further posts,


real_angular_flask__


Do not handle webservers, JAM Stack and Netlify.

Once we finished the UI and the API, we launched it over an nginx web servers farm. Also we decided to use a CDN to improve user experience in terms of speed and also to help us prevent site crashes in the event of traffic usage peaks. So, in this case, the CDN would help us to distribute bandwidth across multiple servers, instead of having to use just one server handling all the traffic.

While searching the internet looking for a good and affordable CDN we discovered Netlify and the JAMStack.

“JAM stands for JavaScript, APIs and Markup. It’s the fastest growing stack for building websites and apps: no more servers, host all your front-end on a CDN and use APIs for any moving parts[…] The JAMstack uses markup languages like HTML, CSS and Markdown to format and style our content, client-side Javascript to make it interactive and engaging and APIs to add persistence, real-time sync, real-world interactions, comments, shopping carts, and so on.“ – https://jamstack.org/

“Netlify is a unified platform that automates your code to create high-performant, easily maintainable sites and web apps” . – https://www.netlify.com/


captura-de-pantalla-de-2016-11-03-12-50-03


So, we decided to use Netlify. It allow us to bring an automated platform to deploy our AngularJS app, because it follows the JAMStack, and also provide us with the best practices like CDN distribution, caching and continuous deployment with a single click – or command. That means not handling webservers, therefore less effort and work. For a startup like us that’s very valuable.

With Netlify we just push our site to their CDN because it pairs naturally with Git. That’s why you only need to pull, change and push the code to manage your site. After a git push, the newest version is immediately available everywhere and with their integrations you can set up any number of outbound webhooks so you can receive an e-mail or Slack notifications to notify for deploy information or build failures.

Netlify has a lot of features like DDoS protection, Snapshots, Versioning & Rollbacks, Instant Cache Invalidation, DNS Hosting, Domain Registration, etc. You can check more Netlify features here: https://www.netlify.com/features/

In the next post I’ll review the API and the AMQP topics about how we built our Software. Stay tuned.

Share this
13 Oct 2016

How build a SaaS around OpenStack (I)

How does Sentinelle Labs build apps?  What pieces interact in our platform in order to successfully capture and process agent’s data to monitor, backtrace and send notifications if something goes wrong in an OpenStack deployment?

We’ve decided that it’s time to share more details around this topic. In this series, we’ll describe our architecture and technologies used to go from source code to a deployed service to show you how your OpenStack deployment is working. You can expect this to be the first of many posts detailing the architecture and the challenges of building and deploying a SaaS to enhance OpenStack skills,  reduce OpenStack learning curve  and Backtrace it much faster. Sentinel.la is a fastest way to OpenStack.


High level design

The High-level design (HLD) explains the architecture used for developing a software product. The architecture diagram provides an overview of the entire system, identifying the main components that will be developed for the product along with their interfaces.

sentinella-hld-001


Decoupled architecture

As you can see, we’ve used a decoupled architecture approach. This is a type of architecture that enables components/ layers to execute independently so they can interact with each other using well-defined interfaces rather than depending tightly on each other.


API

The first step in order to address a decoupled architecture is to build an API. There’s nothing more important than the application program interface to link components with each other. Our API is called “Medusa” and is built with Flask. An API is a great way to expose an application’s functionality to external applications in a safe and secure way. In our case that external app is “Apollo”, our UI, which will be reviewed later.


MQ

Sentinel.la uses a Message queuing system (in this case RabbitMQ). The MQ acts as middleware that allows the software to communicate the different layers/pieces that are being used. The systems can remain completely autonomous and unaware of each other. Instead of building one large application, it’s a better practice to decouple different parts of your application and only communicate between them asynchronously with messages.

We use Celery, a task queue with batteries included written in Python to manage our queue, as I mentioned above, our broker is RabbitMQ and also it does manage the workers that consume all the tasks/messages.


UI

Our UI is called “Apollo”. It’s built in AngularJS, and is an ”API-Centric” Web Application. Basically, it executes all its functionalities through API calls. For example, to log in a user, we send its credentials to the API, and then the API will return a result indicating if the user provided the correct user-password combination. Also we are following the JAM stack conventions. JAM stack is an ideal way of building static websites, in later posts we’ll explain it but the basic idea is that JAM, that stands for JavaScript, APIs and Markup, is to avoid managing servers, but to host all your front-end over a CDN and use APIs for any moving parts.


Datastore

Behind scenes, all data is stored in 4 different databases. We use InfluxDB, a scalable datastore for metrics, events, and real-time analytics. Also we use Rethinkdb the open-source database for the realtime web. One of the components that we use also need MongoDB, an open source database that uses a document-oriented data model. Our relational database is PostgreSQL, an open source relational database management system (DBMS).


Agents

Our platform uses all the information generated on the differents OpenStack. To address that we’ve built an agent 100% written in python (available at https://github.com/Sentinel-la/sentinella-agent/). In order to install it, there are .deb for Ubuntu/Debian and .rpm for RedHat/CentOS packages. Also we have a pip package to install it in SuSE https://pypi.org/project/sentinella/


Data processing engines

To evaluate all the thresholds we developed 2 different daemons, one for InfluxDB (called “Chronos”) and another one for RethinkDB (called “Aeolus”). These pieces have all the rules and logic to rise an alert when something wrong is detected.


Alerta.io

Obviously we need a component that manages all the alerts risen by Chronos and Aeolus. We are proudly using Alerta.io to consolidate all the alerts an also perform de-duplication, simple correlation and trigger the notifications.


Notifications delivery

We send 3 different types of notifications for an alert. First, we send an email (we use Mandrill, the transactional email as a service from Mailchimp). We’ve decided not to maintain an SMTP server. Second, we send slack alerts using their webhooks integrations. Third, of course, we notificate users on Sentinel.la Dashboard pushing alerts to Apollo. In order to accomplish that we use Thunderpush, a Tornado and SockJS based push service. It provides a Beaconpush inspired HTTP API and client.

So far, these are the main components that work together in order to deliver Sentinel.la service. In further posts we’ll do a deeper review of all of them. Next post will be about Apollo, our UI, and the JAM stack.

Thanks for reading, your comments are very welcome.

Share this
09 Aug 2016

Sentinel.la now available at PyPI

We are glad to announce that the sentinel.la agent is now available at Python Package Index (PyPI)  the official third-party software repository for Python. https://pypi.python.org/pypi/sentinella

PyPI primarily hosts Python packages in the form of archives known as Python Eggs. Similarly to JAR archives in Java – Eggs are fundamentally ZIP files, but with the .egg extension, that contains the Python code for the package itself, and a setup.py file that holds the package’s metadata.

You can access to PyPI with several package managers, includings EasyInstall, PyPM and pip that use Pypi as the default source for packages and their dependencies.

So you will be able to install the sentinel.la agent with pip as following:

guillermo@xps13:~/$ pip install sentinella

With this, Sentinel.la is available for:


Also, remember to vote for our presentation to OpenStack Summit at Barcelona:


Captura de pantalla de 2016-08-09 17-22-56

Vote here:  Double Win! Helping to consolidate OpenStack implementations (and build a Startup in the meantime)

Keep in touch with us while we’re building the next big thing,

Email: hello@sentinel.la


Share this
23 Apr 2016

Keep Austin Nerd! We’re in, are you? #OpenStackSummit

IMAG0141 (1)


The Openstack Summit is attended by thousands of people from the whole world. This time the thirteenth release of OpenStack, codenamed Mitaka is ready.  This version has improved user experience, manageability, and scalability.  To see the whole agenda: https://www.openstack.org/summit/austin-2016/summit-schedule#day=2016-04-25

In the OpenStack Summit you will plan your cloud strategy and hear about market opportunities, latest products, tools and services like Sentinel.la, from the OpenStack ecosystem. We are ready to learn about operational experience directly from users.

So, our team will be attending the OpensStack Summit with this  t-shirts, do you like it?  what about getting one?

IMAG0139 (1)


Please just send us a tweet to @The_sentinella to obtain a t-shiirt and a sticker and meet us at the event, we’ll be attending sessions and being around the Marketplace. See you at the Openstack Summit!

Share this
20 Feb 2016

Sentinel.la Agent: opensource leverages security

The best way to show off our commitment with the opensource community is using it into every day activities. Sentinel.la agent is based on tourbillon. We’ve forked this project and begun to customize to our purpose.

You have access to the agent’s code to verify that it’s absolutely safe to install and run. Most of the monitoring tool’s agents work over a binary file no bringing enough information of what exactly is doing on your system (or your information). Also this agent run with a user named sentinella (group sentinella) with limited access to your system and files.

Agent installation

Get the agent from out site and get this up using “sentinella init” command. It will be available via debian (.deb) or centos (.rpm) package. Install it as local for now. We’ve got into a repo soon. You will need to identify your account ID (get that key number directly from the console as the next picture shows).sentinel.la openstack monitoring healthcheck service nova neutron heat cinder ceilometer.001Run this agent at any OpenStack node located in any of your instances or datacenters.

root@sf-openstack01:/tmp# sentinella init
Configure Sentinel.la agent
Enter your Account Key []: 32j4u23iy4u23i

Later you will be asked what OpenStack services you will monitor as the following:

OpenStack configuration

Monitor nova-api? [yes]:
Name of the nova-api process [nova-api]:
nova-api log file [/var/log/nova/nova-api.log]:

Monitor nova-scheduler? [yes]:
Name of the nova-scheduler process [nova-scheduler]:
nova-scheduler log file [/var/log/nova/nova-scheduler.log]:

Monitor nova-compute? [yes]:
Name of the nova-compute process [nova-compute]:
nova-compute log file [/var/log/nova/nova-compute.log]:

Monitor nova-cert? [yes]: n

Monitor nova-conductor? [yes]: n

Monitor nova-novncproxy? [yes]: n

Monitor neutron-server? [yes]:
Name of the neutron-server process [neutron-server]:
neutron-server log file [/var/log/neutron/server.log]:

Monitor neutron-dhcp-agent? [yes]:
Name of the neutron-dhcp-agent process [neutron-dhcp-agent]:
neutron-dhcp-agent log file [/var/log/neutron/dhcp-agent.log]:

Monitor neutron-openvswitch-agent? [yes]:
Name of the neutron-openvswitch-agent process [neutron-openvswitch-agent]:
neutron-openvswitch-agent log file [/var/log/neutron/openvswitch-agent.log]:

Monitor neutron-l3-agent? [yes]:
Name of the neutron-openvswitch-agent process [neutron-openvswitch-agent]:
neutron-l3-agent log file [/var/log/neutron/l3-agent.log]:

Monitor neutron-metadata-agent? [yes]:
Name of the neutron-metadata-agent process [neutron-metadata-agent]:
neutron-metadata-agent log file [/var/log/neutron/metadata-agent.log ]:

configuration file generated


We have plans to make this agent detect services automatically, and ask only for what you are actually running on the server.


Setinel.la agent will create a configuration file in JSN format with the information you’ve just chosen.


root@sf-openstack01:/etc/sentinella# cat sentinella.conf
{
    "nova-novncproxy": false, 
    "log_level": "INFO", 
    "neutron-metadata-agent": {
        "process": "neutron-metadata-agent", 
        "log": "/var/log/neutron/metadata-agent.log "
    }, 
    "nova-compute": {
        "process": "nova-compute", 
        "log": "/var/log/nova/nova-compute.log"
    }, 
    "nova-conductor": false, 
    "nova-api": {
        "process": "nova-api", 
        "log": "/var/log/nova/nova-api.log"
    }, 
    "neutron-openvswitch-agent": {
        "process": "neutron-openvswitch-agent", 
        "log": "/var/log/neutron/openvswitch-agent.log"
    }, 
    "account_key": "32j4u23iy4u23i", 
    "neutron-l3-agent": {
        "process": "neutron-openvswitch-agent", 
        "log": "/var/log/neutron/l3-agent.log"
    }, 
    "neutron-dhcp-agent": {
        "process": "neutron-dhcp-agent", 
        "log": "/var/log/neutron/dhcp-agent.log"
    }, 
    "nova-scheduler": {
        "process": "nova-scheduler", 
        "log": "/var/log/nova/nova-scheduler.log"
    }, 
    "neutron-server": {
        "process": "neutron-server", 
        "log": "/var/log/neutron/server.log"
    }, 
    "nova-cert": false, 
    "log_format": "", 
    "log_file": "/var/log/sentinella/sentinella1.log", 
    "plugins_conf_dir": "/etc/sentinella"
}


Configuration file can be copy out other nodes with no issues related to use a different server name or system settings. It would speed up its roll out among geographically dispersed instances.


The agent counts on different options to get a better experience. Sentinel.la will add more features and service through the plug-in concept adopted from tourbillon project. That will be easier to add or remove future services or even develop services on your own for other apps.


root@sf-openstack01:~# sentinella
Usage: sentinella [OPTIONS] COMMAND [ARGS]...

sentinella: send metrics to API

Options:
--version                     Show the version and exit.
-c, --config <config_file>    specify a different config file
-p, --pidfile <pidfile_file>  specify a different pidfile file
--help                        Show this message and exit.

Commands:
clear      remove all plugins from configuration
disable    disable one or more plugins
enable     enable one or more plugins
init       initialize the tourbillon configuration
install    install tourbillon plugin
list       list available tourbillon plugins
reinstall  reinstall tourbillon plugin
run        run the agent
show       show the list of enabled plugins
upgrade    upgrade tourbillon plugin
root@sf-openstack01:~# sentinella show
no enabled plugins


Don’t forget to collaborate.

Share this
17 Feb 2016

Openstack Survey: The price of not knowing is unpredictable

The price of not knowing is unpredictable. The difference between data and information is that information is useful data. Knowing the air temperature in New York is a fact, knowing what your customers expect from you is information. Your  participation as community  in the survey is not only a way for the OpenStack Foundation to gain information about the community and the OpenStack environment , but also a way for us, members of the community to send information about our organizations, services and priorities, so we (as community) are able to define our path, roadmap and strategy.

In short, the OpenStack Foundation is open and listening to know what the community want. We all will gain with the results while the OpenStack foundation will get helpful information too, to do their job and to figure out how to satisfy the priorities of the community.

Do you want to have the opportunity to influence the Openstack roadmap? It should only take about  only 10 minutes to complete the survey at https://www.openstack.org/user-survey/survey-2016-q1/landing

All of the information you provide is confidential to the Foundation (unless you specify otherwise).

Share this
15 Feb 2016

Sentinel.la App’s Server View Panel: Get insight into your OpenStack servers.

This’s part of a serie of posts describing pieces of our amazing app to monitor OpenStack.

The following screenshot belongs to the server view panel. This panel starts showing an overview of the usage and availability of server’s resources , vital signs, openstack services running on it, opened and closed alerts and important log events collected over the last 24 hours.

sentinel.la openstack monitoring healthcheck service nova neutron heat cinder ceilometer monasca.000


The App will collect information from logs, processes and system upon the agent’s installation. This information will help to auto-detect and check the status of OpenStack services running on the server. Once the info is collected, Sentinel.la classify services among OpenStack projects: Nova, Neutron, Cinder, Heat, Glance, Keystone and Ceilometer.

Server View panel shows the OpenStack version running. It shows system information like processor type, memory, kernel version, storage device and capacity. You can identify the server by name and you will able to see the status (i.e. maintenance). Cloud group and location is display under the name of the server.

Note you can still have access to push notification from all your geographically distributed cloud groups at the high right corner of your console. Also, you have the option to add more servers hitting the “+ New” button next to the name of the server.

sentinel.la openstack monitoring healthcheck service nova neutron heat cinder ceilometer monasca.001

You have three buttons to change your server’s status into your overall OpenStack service:

  • Toggle Maintenance Mode: Hit this button if you need to do important maintenance tasks or changes to your server (i.e. Change openstack version). Or do it before to remove it from the App (You will be able to remove the server 10min after the App stops receiving data from it). Your overall uptime will not be affected in case the server stop sending data or removal.
  • Toggle Blackout Mode: Hit this button if you need to do minor changes for troubleshooting on the server. The idea is to stop sending unnecessary notifications. The server is under control and in fixing activities. Uptime indicator is still affected under this mode to estimate the impact of the current event being handled.
  • Classify Server: use this button to be re-group the server into other cloud system

sentinel.la openstack monitoring healthcheck service nova neutron heat cinder ceilometer monasca.002


This view has other options to get a better insight of the services, log events and vital signs. Those can be accessed through the menu bellow the server’s description:

  • Overview: This option get you back to the server´s dashboard
  • Alerts: This option get you to a panel with alert’s information over the last 24 hours (The panel shows only the last 5 opened alerts). You will be able to see what alerts has been closed and ones are still opened in a chronological order
  • Vital Signs: Get vital signs’ details of the server over the last 24 hours
  • OpenStack Services: Get better insight of the OpenStack’s services running on the server and their heath.
  • OpenStack Logs: It gets you to a panel with all the important events collected over the last 24 hours. Important events are errors, critical and warnings. This information will help you the get a better understanding of any issue and use it for troubleshooting purposes. The panel brings events in a chronological order and online search options to group events by keywords.

At the right side, you see information of the amount of the alerts are still opened, the server’s uptime and the current server’s load average over the last 24 hours.

sentinel.la openstack monitoring healthcheck service nova neutron heat cinder ceilometer.003

A chart showing the amount of warnings, errors and critical events over the last 24 hours has been located under the menu options. This brings you a sample of much activity you are having into the server.

Server vita signs are also shown under the log events chart. The average of CPU, Memory and Disk utilization over the last 24 hours. Even the amount of alerts that have been closed over the last 24 hours.

sentinel.la openstack monitoring healthcheck service nova neutron heat cinder ceilometer monasca.004

Information regarding last alerts has been located next to the last panel. A column with the last 5 alerts has been posted with some details in regards to the OpenStack processes and the subject of the event that causes it.

Counters showing the current status of CPU, Memory and Disk usage is also displayed. Next to this counters, you find the “OpenStack services status” bringing a fast snap of the amount of inactive processes out of the every OpenStack’sservice in the server.

sentinel.la openstack monitoring healthcheck service nova neutron heat cinder ceilometer monasca.005


Share this
09 Feb 2016

JSON Web Tokens for dummies

Authentication is one of the most important decisions when we are bulding a web application. Modern web apps are One-page apps, built on top of technologies like AngularJS . In that case, we don’t want to waste time building markup and representation layers, instead of that we are building APIs that our front-end consume. So these changes have led to new ways of implementing authentication into this modern applications.

There are basically two different ways of implementing server side authentication for apps that consist of a frontend and an API. The most adopted one is the traditional Session Based Authentication. In traditional authentication, the user logs in with its credentials, then the server validates the information and stores it in session objects, either in memory or on disk.

Common Session based Authentication problems

This Session based Authentication has the following problems:

Overload

When a user is authenticated, the server needs to remind somehow, usually keeping the information in memory. When many people are online, server overhead increases.

Scalability

From the moment we keep user information stored on session, there are scalability issues. Imagine that our application needs autoscale to meet peak demands and load balancing across multiple servers. While we are keeping the user on the server session if there’s a new request sent to another node then user needs to log in again. This can be solved using the technique known as Sticky Session but even with that solution it doesn’t feel optimal. With token-based authentication, this is solved naturally, as we’ll review.

CORS

Most often we want our data to be consumed from multiple mobile devices (tablets, smartphones, etc …). In this scenario it’s important to worry about what is called CORS: cross-origin resource sharing or sharing of resources from different sources. When we use AJAX to retrieve data from our application, we can find us getting unauthorized requests because modern browsers don’t allow this type of behaviour for security concerns.

JSON Web Tokens

One of the best known solutions to authentication problems for APIs are JSON Web Tokens or JWT. The token-based authentication is stateless. This means that you do not save any user information on the server or the session. This kind of authentication sends a token for each request through the HTTP headers instead of keeping authentication information sessions or cookies. Thus, no state is saved between different requests of our application and our data can be consumed from different types of clients.

As tokens are stored on the client side, we don have to care about status information or session so our app application becomes completely scalable. We can use the same API for different apps likeWeb, Mobile, Android, iOS so we just worry about sending the data in JSON format and generate and decrypt authentication tokens through a middleware.

From user’s perspective, there’s no different between login in into an application that uses JWT and an application that uses traditional authentication. The user enters their credentials checked against the server’s storage or service, but rather to create a session and return a cookie, it will return a JSON object containing JWT.  The JWT  needs to be stored in client side, which is usually done in the local storage The JWT must be sent to the server to access protected routes. The token is generally sent via an HTTP Authorization Header.

You can think of this token as your hotel’s room card. When yo visit a hotel, you go to the hotel’s desk and you give your credentials so they give you a card. In this case, the card is your token and you’ll be able to access to your room with it. We can go into our room but we can’t use our card to go into other room. Who has the card? Does the hotel have it? No, we do have it, as we have the JWT and the server doesn’t store a session for us. When we leave, if we don’t return the card, we will have a useless piece of plastic. That means the tokens has an expiration.

In the next post, we will review the structure of a JSON web token and how can we implement it in AngularJS.

Share this
19 Jan 2016

OpenStack services on a Time-Series database

“Measure what is measurable, and make measurable what is not so.”

Galileo Galilei


At Sentinel.la, one of the services we provide is the centralization of data & statistics with a OpenStack centered approach, from OpenStack services (nova-* , neutron-* , keystone and so on…) to even get performance and status of vital server resources. All this information is acquired using an nondependent role server architecture (All-in-Ones, dedicated Controller/Compute/Storage deployments, Converged deployments, we must support and fetch data from all those types of deployments.)

Managing all this information requires a very flexible way of organization and handling. Our first Proof of Concept attempt was to create an agent that gathers all the server information at Operating System level, so the basic information was being captured: CPU, Disk Usage, Memory Usage and Load Average. All this information was being stored on a Relational Database.

The problem with Relational Databases is that they are not optimal for handling large amounts of data. Instead of unleashing the power of having such great information you feel like playing Jenga with it, like that with every new row that is added you can’t help but feeling like losing a little bit of performance and scalability. Imagine having millions of rows with CPU data from thousands of servers… that won’t end well.

Jenga_distorted
“Oh yeah, INSERT INTO measurements…”

What about using a NoSQL database? Well, standard NoSQL databases help a lot managing large chunks of document data, but time series is different: imagine that instead of growing vertical rows, your data grows sideways and it depends heavily on the time when the data was saved. So, if not a standard NoSQL, what should we use to save our metrics? And what about if instead just 5 metrics we want to capture “n” metrics for “n” services on “n” devices?

This is where a Time-Series database is useful. On this type of database you have a timestamp that is the equivalent of the Id, so your values are always associated with it. Those values are organized in series, which are a collection of a measurement (CPU usage, disk usage, etc.) and the tags that you employ to identify that measurement (server name, cloud id, server location, etc.)

Having the data stored on a Time-Series database enables you to think of the information as points, which are easy to identify, search, display and graph. You have many functions to manipulate the data and get the right information. In our case we realized that we could use some aggregations and transformations functions to get things like behavior over time with great precision and accuracy.

For this purposes we chose InfluxDB as our time-series database because Monasca uses it and while we were playing with Monasca we found out that it was perfect for what we do. Also InfluxDB can be used “as a service”, the same guys from InfluxData that created the product offer it as a service. This way we can use (and love) InfluxDB features with High Availability without having to operate it and thus we can focus in our core business.

We feel very fortunate to coincide our development with InfluxDB lifecycle. We started using it at the very moment when the 0.9 version was released. This version was a turning point because it added support for tags. Also it’s a little bit different in terms of syntax and other functionalities like a new thresholding and alerting component (Kapacitor) which was introduced the very same week we were researching and developing our metrics alerting engine!

A whole new world

After solving the database backend and having no limits with performance and reliability now comes the sweet part: we can store all the measurements that we want. We began getting I/O values from servers, and started having OpenStack service related information at first. How much CPU does nova-api use? Is nova-scheduler having peaks of memory? What’s the uptime of nova-compute process? The limit is only our (OpenStack) imagination.

nova

References:

Influx Data https://influxdata.com/

Share this

All rights reserved© 2017 Sentinelle Labs.  Terms and conditions | Privacy Policy

Click Me