13 Oct 2016

How build a SaaS around OpenStack (I)

How does Sentinelle Labs build apps?  What pieces interact in our platform in order to successfully capture and process agent’s data to monitor, backtrace and send notifications if something goes wrong in an OpenStack deployment?

We’ve decided that it’s time to share more details around this topic. In this series, we’ll describe our architecture and technologies used to go from source code to a deployed service to show you how your OpenStack deployment is working. You can expect this to be the first of many posts detailing the architecture and the challenges of building and deploying a SaaS to enhance OpenStack skills,  reduce OpenStack learning curve  and Backtrace it much faster. Sentinel.la is a fastest way to OpenStack.


High level design

The High-level design (HLD) explains the architecture used for developing a software product. The architecture diagram provides an overview of the entire system, identifying the main components that will be developed for the product along with their interfaces.

sentinella-hld-001


Decoupled architecture

As you can see, we’ve used a decoupled architecture approach. This is a type of architecture that enables components/ layers to execute independently so they can interact with each other using well-defined interfaces rather than depending tightly on each other.


API

The first step in order to address a decoupled architecture is to build an API. There’s nothing more important than the application program interface to link components with each other. Our API is called “Medusa” and is built with Flask. An API is a great way to expose an application’s functionality to external applications in a safe and secure way. In our case that external app is “Apollo”, our UI, which will be reviewed later.


MQ

Sentinel.la uses a Message queuing system (in this case RabbitMQ). The MQ acts as middleware that allows the software to communicate the different layers/pieces that are being used. The systems can remain completely autonomous and unaware of each other. Instead of building one large application, it’s a better practice to decouple different parts of your application and only communicate between them asynchronously with messages.

We use Celery, a task queue with batteries included written in Python to manage our queue, as I mentioned above, our broker is RabbitMQ and also it does manage the workers that consume all the tasks/messages.


UI

Our UI is called “Apollo”. It’s built in AngularJS, and is an ”API-Centric” Web Application. Basically, it executes all its functionalities through API calls. For example, to log in a user, we send its credentials to the API, and then the API will return a result indicating if the user provided the correct user-password combination. Also we are following the JAM stack conventions. JAM stack is an ideal way of building static websites, in later posts we’ll explain it but the basic idea is that JAM, that stands for JavaScript, APIs and Markup, is to avoid managing servers, but to host all your front-end over a CDN and use APIs for any moving parts.


Datastore

Behind scenes, all data is stored in 4 different databases. We use InfluxDB, a scalable datastore for metrics, events, and real-time analytics. Also we use Rethinkdb the open-source database for the realtime web. One of the components that we use also need MongoDB, an open source database that uses a document-oriented data model. Our relational database is PostgreSQL, an open source relational database management system (DBMS).


Agents

Our platform uses all the information generated on the differents OpenStack. To address that we’ve built an agent 100% written in python (available at https://github.com/Sentinel-la/sentinella-agent/). In order to install it, there are .deb for Ubuntu/Debian and .rpm for RedHat/CentOS packages. Also we have a pip package to install it in SuSE https://pypi.org/project/sentinella/


Data processing engines

To evaluate all the thresholds we developed 2 different daemons, one for InfluxDB (called “Chronos”) and another one for RethinkDB (called “Aeolus”). These pieces have all the rules and logic to rise an alert when something wrong is detected.


Alerta.io

Obviously we need a component that manages all the alerts risen by Chronos and Aeolus. We are proudly using Alerta.io to consolidate all the alerts an also perform de-duplication, simple correlation and trigger the notifications.


Notifications delivery

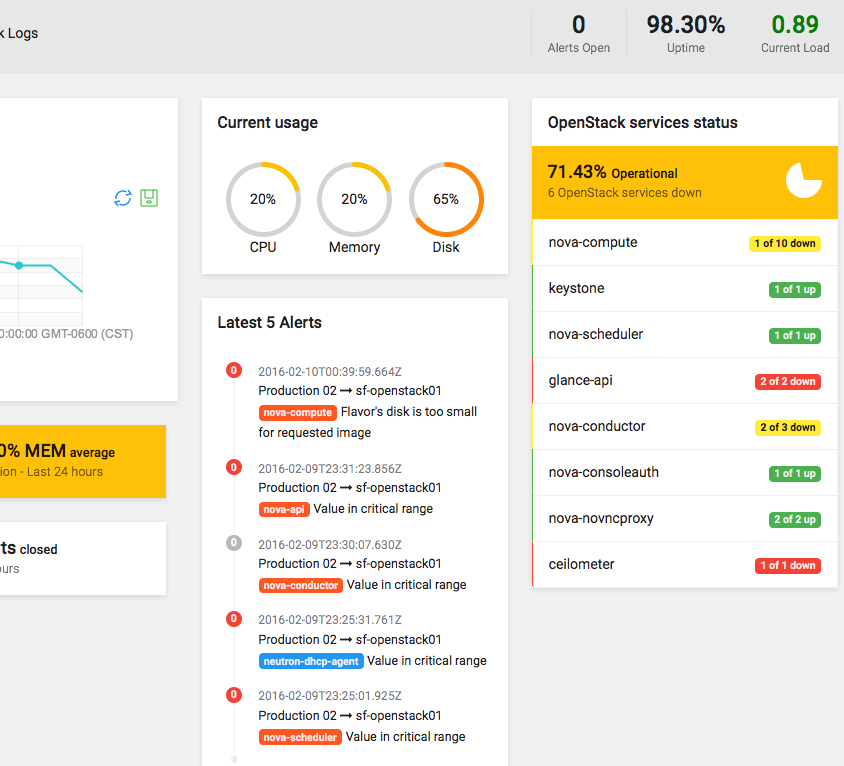
We send 3 different types of notifications for an alert. First, we send an email (we use Mandrill, the transactional email as a service from Mailchimp). We’ve decided not to maintain an SMTP server. Second, we send slack alerts using their webhooks integrations. Third, of course, we notificate users on Sentinel.la Dashboard pushing alerts to Apollo. In order to accomplish that we use Thunderpush, a Tornado and SockJS based push service. It provides a Beaconpush inspired HTTP API and client.

So far, these are the main components that work together in order to deliver Sentinel.la service. In further posts we’ll do a deeper review of all of them. Next post will be about Apollo, our UI, and the JAM stack.

Thanks for reading, your comments are very welcome.

Share this
09 Aug 2016

Sentinel.la now available at PyPI

We are glad to announce that the sentinel.la agent is now available at Python Package Index (PyPI)  the official third-party software repository for Python. https://pypi.python.org/pypi/sentinella

PyPI primarily hosts Python packages in the form of archives known as Python Eggs. Similarly to JAR archives in Java – Eggs are fundamentally ZIP files, but with the .egg extension, that contains the Python code for the package itself, and a setup.py file that holds the package’s metadata.

You can access to PyPI with several package managers, includings EasyInstall, PyPM and pip that use Pypi as the default source for packages and their dependencies.

So you will be able to install the sentinel.la agent with pip as following:

guillermo@xps13:~/$ pip install sentinella

With this, Sentinel.la is available for:


Also, remember to vote for our presentation to OpenStack Summit at Barcelona:


Captura de pantalla de 2016-08-09 17-22-56

Vote here:  Double Win! Helping to consolidate OpenStack implementations (and build a Startup in the meantime)

Keep in touch with us while we’re building the next big thing,

Email: hello@sentinel.la


Share this
20 Feb 2016

Sentinel.la Agent: opensource leverages security

The best way to show off our commitment with the opensource community is using it into every day activities. Sentinel.la agent is based on tourbillon. We’ve forked this project and begun to customize to our purpose.

You have access to the agent’s code to verify that it’s absolutely safe to install and run. Most of the monitoring tool’s agents work over a binary file no bringing enough information of what exactly is doing on your system (or your information). Also this agent run with a user named sentinella (group sentinella) with limited access to your system and files.

Agent installation

Get the agent from out site and get this up using “sentinella init” command. It will be available via debian (.deb) or centos (.rpm) package. Install it as local for now. We’ve got into a repo soon. You will need to identify your account ID (get that key number directly from the console as the next picture shows).sentinel.la openstack monitoring healthcheck service nova neutron heat cinder ceilometer.001Run this agent at any OpenStack node located in any of your instances or datacenters.

root@sf-openstack01:/tmp# sentinella init
Configure Sentinel.la agent
Enter your Account Key []: 32j4u23iy4u23i

Later you will be asked what OpenStack services you will monitor as the following:

OpenStack configuration

Monitor nova-api? [yes]:
Name of the nova-api process [nova-api]:
nova-api log file [/var/log/nova/nova-api.log]:

Monitor nova-scheduler? [yes]:
Name of the nova-scheduler process [nova-scheduler]:
nova-scheduler log file [/var/log/nova/nova-scheduler.log]:

Monitor nova-compute? [yes]:
Name of the nova-compute process [nova-compute]:
nova-compute log file [/var/log/nova/nova-compute.log]:

Monitor nova-cert? [yes]: n

Monitor nova-conductor? [yes]: n

Monitor nova-novncproxy? [yes]: n

Monitor neutron-server? [yes]:
Name of the neutron-server process [neutron-server]:
neutron-server log file [/var/log/neutron/server.log]:

Monitor neutron-dhcp-agent? [yes]:
Name of the neutron-dhcp-agent process [neutron-dhcp-agent]:
neutron-dhcp-agent log file [/var/log/neutron/dhcp-agent.log]:

Monitor neutron-openvswitch-agent? [yes]:
Name of the neutron-openvswitch-agent process [neutron-openvswitch-agent]:
neutron-openvswitch-agent log file [/var/log/neutron/openvswitch-agent.log]:

Monitor neutron-l3-agent? [yes]:
Name of the neutron-openvswitch-agent process [neutron-openvswitch-agent]:
neutron-l3-agent log file [/var/log/neutron/l3-agent.log]:

Monitor neutron-metadata-agent? [yes]:
Name of the neutron-metadata-agent process [neutron-metadata-agent]:
neutron-metadata-agent log file [/var/log/neutron/metadata-agent.log ]:

configuration file generated


We have plans to make this agent detect services automatically, and ask only for what you are actually running on the server.


Setinel.la agent will create a configuration file in JSN format with the information you’ve just chosen.


root@sf-openstack01:/etc/sentinella# cat sentinella.conf
{
    "nova-novncproxy": false, 
    "log_level": "INFO", 
    "neutron-metadata-agent": {
        "process": "neutron-metadata-agent", 
        "log": "/var/log/neutron/metadata-agent.log "
    }, 
    "nova-compute": {
        "process": "nova-compute", 
        "log": "/var/log/nova/nova-compute.log"
    }, 
    "nova-conductor": false, 
    "nova-api": {
        "process": "nova-api", 
        "log": "/var/log/nova/nova-api.log"
    }, 
    "neutron-openvswitch-agent": {
        "process": "neutron-openvswitch-agent", 
        "log": "/var/log/neutron/openvswitch-agent.log"
    }, 
    "account_key": "32j4u23iy4u23i", 
    "neutron-l3-agent": {
        "process": "neutron-openvswitch-agent", 
        "log": "/var/log/neutron/l3-agent.log"
    }, 
    "neutron-dhcp-agent": {
        "process": "neutron-dhcp-agent", 
        "log": "/var/log/neutron/dhcp-agent.log"
    }, 
    "nova-scheduler": {
        "process": "nova-scheduler", 
        "log": "/var/log/nova/nova-scheduler.log"
    }, 
    "neutron-server": {
        "process": "neutron-server", 
        "log": "/var/log/neutron/server.log"
    }, 
    "nova-cert": false, 
    "log_format": "", 
    "log_file": "/var/log/sentinella/sentinella1.log", 
    "plugins_conf_dir": "/etc/sentinella"
}


Configuration file can be copy out other nodes with no issues related to use a different server name or system settings. It would speed up its roll out among geographically dispersed instances.


The agent counts on different options to get a better experience. Sentinel.la will add more features and service through the plug-in concept adopted from tourbillon project. That will be easier to add or remove future services or even develop services on your own for other apps.


root@sf-openstack01:~# sentinella
Usage: sentinella [OPTIONS] COMMAND [ARGS]...

sentinella: send metrics to API

Options:
--version                     Show the version and exit.
-c, --config <config_file>    specify a different config file
-p, --pidfile <pidfile_file>  specify a different pidfile file
--help                        Show this message and exit.

Commands:
clear      remove all plugins from configuration
disable    disable one or more plugins
enable     enable one or more plugins
init       initialize the tourbillon configuration
install    install tourbillon plugin
list       list available tourbillon plugins
reinstall  reinstall tourbillon plugin
run        run the agent
show       show the list of enabled plugins
upgrade    upgrade tourbillon plugin
root@sf-openstack01:~# sentinella show
no enabled plugins


Don’t forget to collaborate.

Share this
15 Feb 2016

Sentinel.la App’s Server View Panel: Get insight into your OpenStack servers.

This’s part of a serie of posts describing pieces of our amazing app to monitor OpenStack.

The following screenshot belongs to the server view panel. This panel starts showing an overview of the usage and availability of server’s resources , vital signs, openstack services running on it, opened and closed alerts and important log events collected over the last 24 hours.

sentinel.la openstack monitoring healthcheck service nova neutron heat cinder ceilometer monasca.000


The App will collect information from logs, processes and system upon the agent’s installation. This information will help to auto-detect and check the status of OpenStack services running on the server. Once the info is collected, Sentinel.la classify services among OpenStack projects: Nova, Neutron, Cinder, Heat, Glance, Keystone and Ceilometer.

Server View panel shows the OpenStack version running. It shows system information like processor type, memory, kernel version, storage device and capacity. You can identify the server by name and you will able to see the status (i.e. maintenance). Cloud group and location is display under the name of the server.

Note you can still have access to push notification from all your geographically distributed cloud groups at the high right corner of your console. Also, you have the option to add more servers hitting the “+ New” button next to the name of the server.

sentinel.la openstack monitoring healthcheck service nova neutron heat cinder ceilometer monasca.001

You have three buttons to change your server’s status into your overall OpenStack service:

  • Toggle Maintenance Mode: Hit this button if you need to do important maintenance tasks or changes to your server (i.e. Change openstack version). Or do it before to remove it from the App (You will be able to remove the server 10min after the App stops receiving data from it). Your overall uptime will not be affected in case the server stop sending data or removal.
  • Toggle Blackout Mode: Hit this button if you need to do minor changes for troubleshooting on the server. The idea is to stop sending unnecessary notifications. The server is under control and in fixing activities. Uptime indicator is still affected under this mode to estimate the impact of the current event being handled.
  • Classify Server: use this button to be re-group the server into other cloud system

sentinel.la openstack monitoring healthcheck service nova neutron heat cinder ceilometer monasca.002


This view has other options to get a better insight of the services, log events and vital signs. Those can be accessed through the menu bellow the server’s description:

  • Overview: This option get you back to the server´s dashboard
  • Alerts: This option get you to a panel with alert’s information over the last 24 hours (The panel shows only the last 5 opened alerts). You will be able to see what alerts has been closed and ones are still opened in a chronological order
  • Vital Signs: Get vital signs’ details of the server over the last 24 hours
  • OpenStack Services: Get better insight of the OpenStack’s services running on the server and their heath.
  • OpenStack Logs: It gets you to a panel with all the important events collected over the last 24 hours. Important events are errors, critical and warnings. This information will help you the get a better understanding of any issue and use it for troubleshooting purposes. The panel brings events in a chronological order and online search options to group events by keywords.

At the right side, you see information of the amount of the alerts are still opened, the server’s uptime and the current server’s load average over the last 24 hours.

sentinel.la openstack monitoring healthcheck service nova neutron heat cinder ceilometer.003

A chart showing the amount of warnings, errors and critical events over the last 24 hours has been located under the menu options. This brings you a sample of much activity you are having into the server.

Server vita signs are also shown under the log events chart. The average of CPU, Memory and Disk utilization over the last 24 hours. Even the amount of alerts that have been closed over the last 24 hours.

sentinel.la openstack monitoring healthcheck service nova neutron heat cinder ceilometer monasca.004

Information regarding last alerts has been located next to the last panel. A column with the last 5 alerts has been posted with some details in regards to the OpenStack processes and the subject of the event that causes it.

Counters showing the current status of CPU, Memory and Disk usage is also displayed. Next to this counters, you find the “OpenStack services status” bringing a fast snap of the amount of inactive processes out of the every OpenStack’sservice in the server.

sentinel.la openstack monitoring healthcheck service nova neutron heat cinder ceilometer monasca.005


Share this
21 Jan 2016

OpenStack international growth

The OpenStack Foundation has been following the correct way during all these years, but what follows is an international leap. Some international companies adopting OpenStack are helping with that. For example, eBay website runs on an OpenStack private cloud platform. Four years ago, eBay’s website was operated fully on its on-premises datacenter infrastructure. “Today, 95% of eBay marketplace traffic is powered by our OpenStack cloud” said Suneet Nandwani, Sr. Director, Cloud Engineering at eBay Inc.

But this international leap won’t happen without some challenges. One of OpenStack main problems is its steep learning curve, you must first achieve a successfully installation and once done, when you think you have done it, things could get ugly. There’s no definite strategy to operate an OpenStack deployment, but with the right tools and the right information on a timely manner, this could be done without pain.

That’s our commitment at Sentinel.la: “Reduce the operational pain of Cloud Administrator/SysOp Teams providing quick, concise and relevant information to solve the problems related to a real OpenStack deployment”.

The other point of inflection to achieve a succesfully international leap are containers and projects such as Murano and Magnum “People are really excited to see how frameworks like Docker and Kubernetes enable companies to bring containers in and make use of them with the networking and security frameworks that they already have,” said Jonathan Bryce, OpenStack Foundation Executive Director.

Take a look to the interview from theCUBE to Jonathan Bryce and Lauren Sell at the Openstack Day Seattle 2015 – theCUBE

Read the complete history: “OpenStack Foundation ready for international growth | #OpenStackSeattle” from Silicon Angle

Share this
11 Jan 2016

Mastering the Openstack logs

how fast do you detect a problem in your deployment? no problem is so serious as it seems when talking about Openstack errors. The secret is in mastering the logs.Openstack and their components that run on top of it can generate all different types of messages, which are recorded in various log files.

Whenever a problem occurs in an Openstack deployment, the first place you should look up is in the logs. Analyzing the information provided in the logs, you may be able to detect what the problem is and where the error occurs. A lot of time the user interface only shows “An error occurred” but all the information regarding that error resides in the log file. You can use these messages for troubleshooting and monitoring system events.

Openstack has several services, and each of them have a log file, so there are a large number of log files. A good DevOps team that are managing an Openstack deployment -no matter the size- should need to locate the logs and learn how to work with them track the status and health of their deployment.

Where are the Openstack logs?

The Openstack services use a common location for their logs, in a default configuration of an openstack deployment, log files are located in subdirectories of /var/log directory:


Captura de pantalla de 2016-01-07 10:24:42


Table from: http://docs.openstack.org/openstack-ops/content/logging_monitoring.html#openstack-log-locations

OpenStack uses the following logging levels: DEBUG, INFO, AUDIT, WARNING, ERROR, CRITICAL, and TRACE.  What do each level mean?

  • Debug: Shows everything and is likely not suitable for normal production operation due to the sheer size of logs generated
  • Info: Usually indicates successful service start/stop, versions and such non-error related data. This should include largely positive units of work that are accomplished (such as starting a compute, creating a user, deleting a volume, etc.)
  • Audit: REMOVE – (all previous Audit messages should be put as INFO)
  • Warning: Indicates that there might be a systemic issue; potential predictive failure notice
  • Error: An error has occurred and an administrator should research the event
  • Critical: An error has occurred and the system might be unstable; immediately get administrator assistance

from: http://stackoverflow.com/questions/2031163/when-to-use-log-level-warn-vs-error/2031209#2031209


So the messages in the log files only appear if they are more “severe” than the log level that is set. For example using DEBUG we are allowing all log statements through. If you set DEBUG flag as FALSE only debug messages will be discarded. If you don’t want to see your logs polluted by INFO messages saying “hey, I’m here asking for somewhat!” then you can set VERBOSE as FALSE making WARNING the default. 

*Those configurations are by service, so you need to change it on every conf file (of each service).

As you may know, there are logs by non-openstack components. OpenStack uses a lot of libraries, which do have their own definitions of logging. This logs can be wildly different because each one has their own definitions(MySQL, SQLAlchemy, KVM, OVS, Ceph,etc).

How do an Openstack log record  looks?

The following is an example of a DEBUG log:

2016-01-04 22:41:36.297 DEBUG oslo_db.sqlalchemy.engines [req-af32b586-0aab-4846-b097-12604699d5ec None None] MySQL server mode set to STRICT_TRANS_TABLES,STRICT_ALL_TABLES,NO_ZERO_IN_DATE,NO_ZERO_DATE,ERROR_FOR_DIVISION_BY_ZERO,TRADITIONAL,NO_AUTO_CREATE_USER,NO_ENGINE_SUBSTITUTION _check_effective_sql_mode /usr/local/lib/python2.7/dist-packages/oslo_db/sqlalchemy/engines.py:256  

Managing your logs

It is good practice to centralize events(logs) from our systems on a server, this server will collect the logs of our systems, classify them and then store them. So, there are two popular log collectors, Fluentd written in CRuby, used in Kubernetes and maintained by Treasure Data Inc and Logstash, written in JRuby and maintained by elastic.co. They have similar features. Both collectors have their own transport protocol, failure Detection and Fallback. Logstash uses Lumberjack protocol, and is Active-Standby only, in other hand Fluentd uses forward protocol and can be deployed as an Active-Active service (load balancing) or Active-Standby. You can read more about Logstash and Fuentd on their sites.

Whatever your decision is, you will need parse the Openstack logs to manipulate them. Yes, regex strikes back, welcome to the regex hell.

memeregex

To save you a little time, we want to share the regular expression to parse the Openstack logs that Sentinel.la DevOps team wrote for such purposes:

Source: https://github.com/Sentinel-la/OpenstackRegexLog


OpenstackRegexLog

Regular expression to parse openstack logs

Example

1.- The following DEBUG log:

2016-01-04 22:41:36.297 DEBUG oslo_db.sqlalchemy.engines [req-af32b586-0aab-4846-b097-12604699d5ec None None] MySQL server mode set to STRICT_TRANS_TABLES,STRICT_ALL_TABLES,NO_ZERO_IN_DATE,NO_ZERO_DATE,ERROR_FOR_DIVISION_BY_ZERO,TRADITIONAL,NO_AUTO_CREATE_USER,NO_ENGINE_SUBSTITUTION _check_effective_sql_mode /usr/local/lib/python2.7/dist-packages/oslo_db/sqlalchemy/engines.py:256

Parsed and stored as json:

{
"time" : "2016-01-04 22:41:36.297",
"description" : "[req-af32b586-0aab-4846-b097-12604699d5ec None None] MySQL server mode set to STRICT_TRANS_TABLES,STRICT_ALL_TABLES,NO_ZERO_IN_DATE,NO_ZERO_DATE,ERROR_FOR_DIVISION_BY_ZERO,TRADITIONAL,NO_AUTO_CREATE_USER,NO_ENGINE_SUBSTITUTION _check_effective_sql_mode /usr/local/lib/python2.7/dist-packages/oslo_db/sqlalchemy/engines.py:256",
"level" : "DEBUG",
"log_id" : null,
"component" : "oslo_db.sqlalchemy.engines ",
}

2.- The following WARNING log:

2016-01-04 22:41:35.221 19090 WARNING oslo_config.cfg [-] Option "username" from group "keystone_authtoken" is deprecated. Use option "user-name" from group "keystone_authtoken".

Parsed and stored as json:

{
"time" : "2016-01-04 22:41:35.221",
"description" : "[-] Option "username" from group "keystone_authtoken" is deprecated. Use option "user-name" from group "keystone_authtoken",
"level" : "WARNING",
"log_id" : 19090,
"component" : "oslo_config.cfg",
}


As you can see, it is very important understand and manage correctly the log files to run an Openstack environment. How are you managing your Openstack logs?

Share this

All rights reserved© 2017 Sentinelle Labs.  Terms and conditions | Privacy Policy

Click Me