20 Feb 2016

Sentinel.la Agent: opensource leverages security

The best way to show off our commitment with the opensource community is using it into every day activities. Sentinel.la agent is based on tourbillon. We’ve forked this project and begun to customize to our purpose.

You have access to the agent’s code to verify that it’s absolutely safe to install and run. Most of the monitoring tool’s agents work over a binary file no bringing enough information of what exactly is doing on your system (or your information). Also this agent run with a user named sentinella (group sentinella) with limited access to your system and files.

Agent installation

Get the agent from out site and get this up using “sentinella init” command. It will be available via debian (.deb) or centos (.rpm) package. Install it as local for now. We’ve got into a repo soon. You will need to identify your account ID (get that key number directly from the console as the next picture shows).sentinel.la openstack monitoring healthcheck service nova neutron heat cinder ceilometer.001Run this agent at any OpenStack node located in any of your instances or datacenters.

root@sf-openstack01:/tmp# sentinella init
Configure Sentinel.la agent
Enter your Account Key []: 32j4u23iy4u23i

Later you will be asked what OpenStack services you will monitor as the following:

OpenStack configuration

Monitor nova-api? [yes]:
Name of the nova-api process [nova-api]:
nova-api log file [/var/log/nova/nova-api.log]:

Monitor nova-scheduler? [yes]:
Name of the nova-scheduler process [nova-scheduler]:
nova-scheduler log file [/var/log/nova/nova-scheduler.log]:

Monitor nova-compute? [yes]:
Name of the nova-compute process [nova-compute]:
nova-compute log file [/var/log/nova/nova-compute.log]:

Monitor nova-cert? [yes]: n

Monitor nova-conductor? [yes]: n

Monitor nova-novncproxy? [yes]: n

Monitor neutron-server? [yes]:
Name of the neutron-server process [neutron-server]:
neutron-server log file [/var/log/neutron/server.log]:

Monitor neutron-dhcp-agent? [yes]:
Name of the neutron-dhcp-agent process [neutron-dhcp-agent]:
neutron-dhcp-agent log file [/var/log/neutron/dhcp-agent.log]:

Monitor neutron-openvswitch-agent? [yes]:
Name of the neutron-openvswitch-agent process [neutron-openvswitch-agent]:
neutron-openvswitch-agent log file [/var/log/neutron/openvswitch-agent.log]:

Monitor neutron-l3-agent? [yes]:
Name of the neutron-openvswitch-agent process [neutron-openvswitch-agent]:
neutron-l3-agent log file [/var/log/neutron/l3-agent.log]:

Monitor neutron-metadata-agent? [yes]:
Name of the neutron-metadata-agent process [neutron-metadata-agent]:
neutron-metadata-agent log file [/var/log/neutron/metadata-agent.log ]:

configuration file generated


We have plans to make this agent detect services automatically, and ask only for what you are actually running on the server.


Setinel.la agent will create a configuration file in JSN format with the information you’ve just chosen.


root@sf-openstack01:/etc/sentinella# cat sentinella.conf
{
    "nova-novncproxy": false, 
    "log_level": "INFO", 
    "neutron-metadata-agent": {
        "process": "neutron-metadata-agent", 
        "log": "/var/log/neutron/metadata-agent.log "
    }, 
    "nova-compute": {
        "process": "nova-compute", 
        "log": "/var/log/nova/nova-compute.log"
    }, 
    "nova-conductor": false, 
    "nova-api": {
        "process": "nova-api", 
        "log": "/var/log/nova/nova-api.log"
    }, 
    "neutron-openvswitch-agent": {
        "process": "neutron-openvswitch-agent", 
        "log": "/var/log/neutron/openvswitch-agent.log"
    }, 
    "account_key": "32j4u23iy4u23i", 
    "neutron-l3-agent": {
        "process": "neutron-openvswitch-agent", 
        "log": "/var/log/neutron/l3-agent.log"
    }, 
    "neutron-dhcp-agent": {
        "process": "neutron-dhcp-agent", 
        "log": "/var/log/neutron/dhcp-agent.log"
    }, 
    "nova-scheduler": {
        "process": "nova-scheduler", 
        "log": "/var/log/nova/nova-scheduler.log"
    }, 
    "neutron-server": {
        "process": "neutron-server", 
        "log": "/var/log/neutron/server.log"
    }, 
    "nova-cert": false, 
    "log_format": "", 
    "log_file": "/var/log/sentinella/sentinella1.log", 
    "plugins_conf_dir": "/etc/sentinella"
}


Configuration file can be copy out other nodes with no issues related to use a different server name or system settings. It would speed up its roll out among geographically dispersed instances.


The agent counts on different options to get a better experience. Sentinel.la will add more features and service through the plug-in concept adopted from tourbillon project. That will be easier to add or remove future services or even develop services on your own for other apps.


root@sf-openstack01:~# sentinella
Usage: sentinella [OPTIONS] COMMAND [ARGS]...

sentinella: send metrics to API

Options:
--version                     Show the version and exit.
-c, --config <config_file>    specify a different config file
-p, --pidfile <pidfile_file>  specify a different pidfile file
--help                        Show this message and exit.

Commands:
clear      remove all plugins from configuration
disable    disable one or more plugins
enable     enable one or more plugins
init       initialize the tourbillon configuration
install    install tourbillon plugin
list       list available tourbillon plugins
reinstall  reinstall tourbillon plugin
run        run the agent
show       show the list of enabled plugins
upgrade    upgrade tourbillon plugin
root@sf-openstack01:~# sentinella show
no enabled plugins


Don’t forget to collaborate.

Share this
15 Feb 2016

Sentinel.la App’s Server View Panel: Get insight into your OpenStack servers.

This’s part of a serie of posts describing pieces of our amazing app to monitor OpenStack.

The following screenshot belongs to the server view panel. This panel starts showing an overview of the usage and availability of server’s resources , vital signs, openstack services running on it, opened and closed alerts and important log events collected over the last 24 hours.

sentinel.la openstack monitoring healthcheck service nova neutron heat cinder ceilometer monasca.000


The App will collect information from logs, processes and system upon the agent’s installation. This information will help to auto-detect and check the status of OpenStack services running on the server. Once the info is collected, Sentinel.la classify services among OpenStack projects: Nova, Neutron, Cinder, Heat, Glance, Keystone and Ceilometer.

Server View panel shows the OpenStack version running. It shows system information like processor type, memory, kernel version, storage device and capacity. You can identify the server by name and you will able to see the status (i.e. maintenance). Cloud group and location is display under the name of the server.

Note you can still have access to push notification from all your geographically distributed cloud groups at the high right corner of your console. Also, you have the option to add more servers hitting the “+ New” button next to the name of the server.

sentinel.la openstack monitoring healthcheck service nova neutron heat cinder ceilometer monasca.001

You have three buttons to change your server’s status into your overall OpenStack service:

  • Toggle Maintenance Mode: Hit this button if you need to do important maintenance tasks or changes to your server (i.e. Change openstack version). Or do it before to remove it from the App (You will be able to remove the server 10min after the App stops receiving data from it). Your overall uptime will not be affected in case the server stop sending data or removal.
  • Toggle Blackout Mode: Hit this button if you need to do minor changes for troubleshooting on the server. The idea is to stop sending unnecessary notifications. The server is under control and in fixing activities. Uptime indicator is still affected under this mode to estimate the impact of the current event being handled.
  • Classify Server: use this button to be re-group the server into other cloud system

sentinel.la openstack monitoring healthcheck service nova neutron heat cinder ceilometer monasca.002


This view has other options to get a better insight of the services, log events and vital signs. Those can be accessed through the menu bellow the server’s description:

  • Overview: This option get you back to the server´s dashboard
  • Alerts: This option get you to a panel with alert’s information over the last 24 hours (The panel shows only the last 5 opened alerts). You will be able to see what alerts has been closed and ones are still opened in a chronological order
  • Vital Signs: Get vital signs’ details of the server over the last 24 hours
  • OpenStack Services: Get better insight of the OpenStack’s services running on the server and their heath.
  • OpenStack Logs: It gets you to a panel with all the important events collected over the last 24 hours. Important events are errors, critical and warnings. This information will help you the get a better understanding of any issue and use it for troubleshooting purposes. The panel brings events in a chronological order and online search options to group events by keywords.

At the right side, you see information of the amount of the alerts are still opened, the server’s uptime and the current server’s load average over the last 24 hours.

sentinel.la openstack monitoring healthcheck service nova neutron heat cinder ceilometer.003

A chart showing the amount of warnings, errors and critical events over the last 24 hours has been located under the menu options. This brings you a sample of much activity you are having into the server.

Server vita signs are also shown under the log events chart. The average of CPU, Memory and Disk utilization over the last 24 hours. Even the amount of alerts that have been closed over the last 24 hours.

sentinel.la openstack monitoring healthcheck service nova neutron heat cinder ceilometer monasca.004

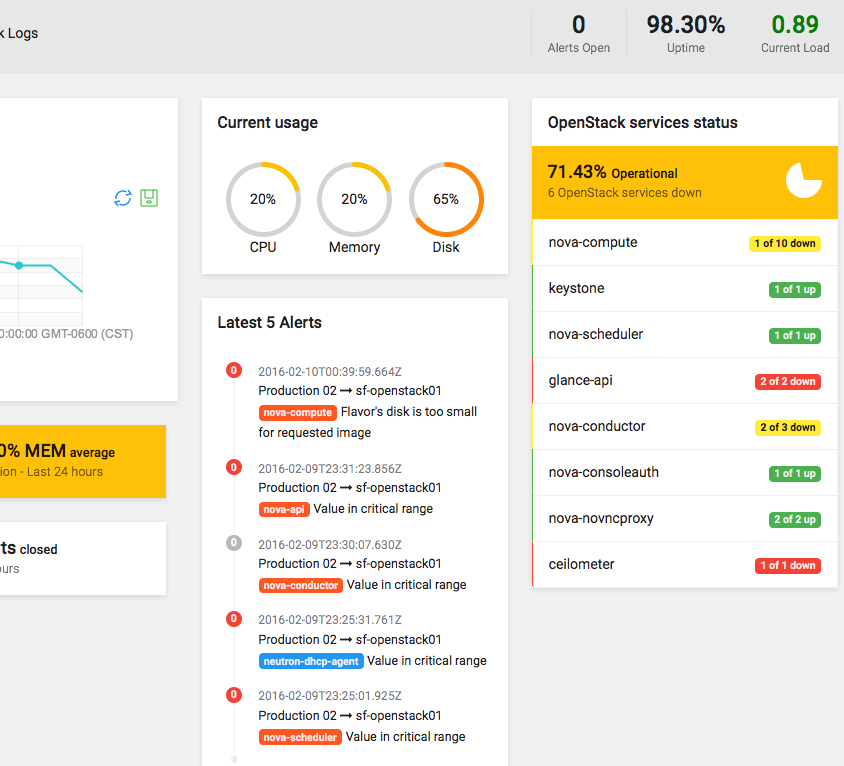
Information regarding last alerts has been located next to the last panel. A column with the last 5 alerts has been posted with some details in regards to the OpenStack processes and the subject of the event that causes it.

Counters showing the current status of CPU, Memory and Disk usage is also displayed. Next to this counters, you find the “OpenStack services status” bringing a fast snap of the amount of inactive processes out of the every OpenStack’sservice in the server.

sentinel.la openstack monitoring healthcheck service nova neutron heat cinder ceilometer monasca.005


Share this
01 Jan 2016

Alameda: Our journey has begun, spread the word

“Would you tell me, please, which way I ought to go from here?’
‘That depends a good deal on where you want to get to,’ said the Cat.
‘I don’t much care where -‘ said Alice.
‘Then it doesn’t matter which way you go,’ said the Cat.
― Lewis Carroll, Alice in Wonderland

The first version of our release Alameda is almost cooked. It´s being an interesting journey from just a piece of paper with some written ideas to getting a real plan witnessed by some coffee shops between Coyoacán and Polanco (BTW, those are in Mexico city)

You have the IDEA. What’s next now?

Vision is everything. If you don´t know where to get to, then the path you take is irrelevant and all the energy spent would be wasted. Definitely, you must define a vision and its supporting values. Thanks that, our product roadmap was built in matters of days.


Company´s pillars have been successfully fulfilled so far.

Product’s design decisions have been taken to keep our company´s pillars: hyper-scalability, interoperability and a smart use of staff on-demand. Avoid any performance bottleneck, even against the unpredicted demand of resources. Leverage any need through on-demand resources. In fact, we’ve got our image and logo through designcrowd.com. Check out my previous post for details about our company´s values and foundations.

Our core service (codename: Medusa) has not been developed from scratch. Specific opensource projects and online platforms have been chosen to stick together. We just code the glue between these blocks – python in the best of the cases.

Collect and manage time-series data is the underlying support for any monitoring service. Create a core platform to do that in an effectively and scalable way, it would have taken forever. Influxdata.com seems to have all what we were looking for. It meets features of being an on-demand resource – we don’t want to spend resources operating and getting tuned a database like this. It would draw us away from our core purpose. Someone else can do it for you.– InfluxDB has Kapacitor, a data processing engine: “Kapacitor lets you define custom logic to process alerts with dynamic thresholds, match metrics for patterns…” Kapacitor makes perfect match with our alert system needs.

We bring three types of thresholds: BINARY (“up” or “down”), TAILABLE (logging information) and GAUGE (for measurements). The alert is evaluated and triggered through Kapacitor (InfluxDB). However, we’ve decided also to use Capped collections (MongoDB).

MongoDB have been added to the equation. It’s delivered in a monthly subscription mode for an important bunch of providers. MongoDB scales out amazingly following the not a recent trend of NoSQL databases in response to the demands presented in building new applications. Its capped collection feature makes data “automatically ages out”. Capped will help us to manage tons of information over the time in the most simple and efficient way.

Figure: Dashboard’s mockup

Our dashboard is being built with AngularJS (Javascript), which is maintained by Google. It offers great portability and flow in applications. A “one-page” experience, so it’s never needed to reload the page. We handle the Model–view–controller (MVC) pattern, which facilitates the addition of components in the future and also provides maintainability – developers independently manage core service and dashboard programming – This is the best example of our flexibility – one of our three pillars – Users could even create their own dashboards to interface to our core monitoring system.

Figure: A glimpse of our dashboard

We are working hard to bring lightweight, secure and highly functional agents. They must be installed on-premises at every openstack’s node, which is the only piece of code to install into your infrastructure – They will remotely reach out our online core service, sending data at every configurable interval of time. Authentication must be strong between agents and our core solution. We’ve decided to leverage this important part of our development on JSON Web Tokens (JWT).

JWT has been used to pass the identity of authenticated users between an identity provider and a service provider. Which is Web Dashboard (Apollo) to RESTful API (Medusa) in our case. The browser doesn’t store sessions, making login functionality fully compatible with mobile devices, without any other change or effort needed – we are preparing ourselves to release Sentinella Android/iOS App in the mid-term – that way you don’t need t manage sensible APIs Keys on premises or into devices – mobile devices could be easily stolen -. APIs don’t expire and change them got a lot of management issues and security concerns. JWT expires constantly and changes transparently to the user.

All these components are talking through an external and secure MQ service – BTW, That could be also externalized to a service provider – The idea to do that is to avoid hard dependencies on every component. That helps us, for example, to make modification to the database´s structures or even change DB´s provider or the DB itself with no service interruption.

What have we got in Alameda?

Our MVP (minimal valuable product) is covering monitoring for Nova and Glance so far. Of course, we´ll add more openstack projects like Keystone and Neutron into the next versions. They way how we are managing versioning is exposed into the next picture.

Figure: Alameda’s roadmap overview

The first version will manage all the components we´ve just mentioned. We are excited to take this online as soon as possible. We are sure this will be an important contribution to the community.

Share this

All rights reserved© 2017 Sentinelle Labs.  Terms and conditions | Privacy Policy

Click Me