Sentinel.la App’s Server View Panel: Get insight into your OpenStack servers.
This’s part of a serie of posts describing pieces of our amazing app to monitor OpenStack.
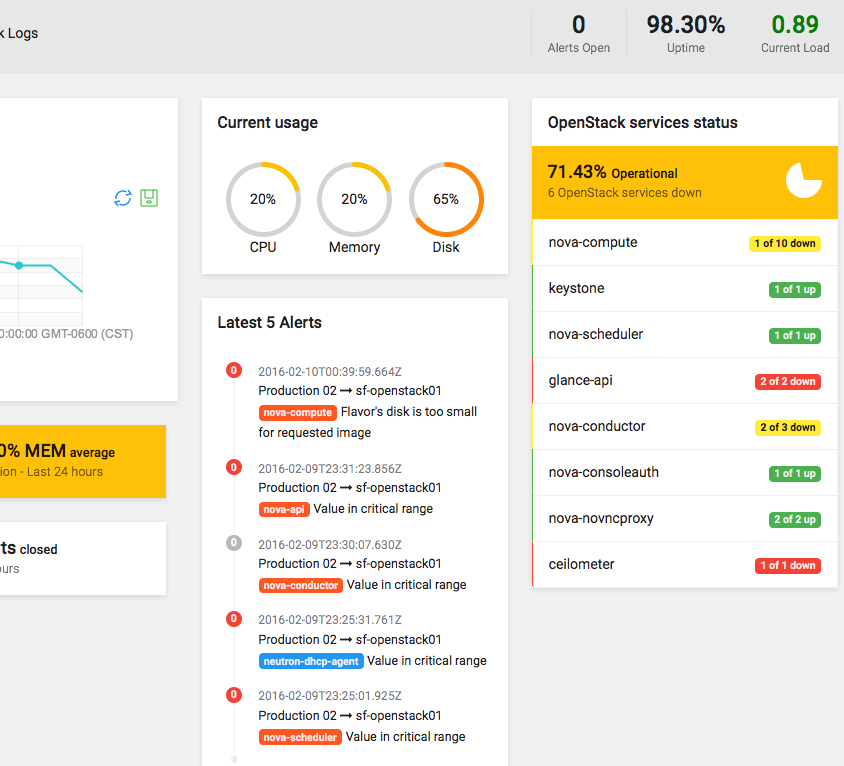
The following screenshot belongs to the server view panel. This panel starts showing an overview of the usage and availability of server’s resources , vital signs, openstack services running on it, opened and closed alerts and important log events collected over the last 24 hours.
The App will collect information from logs, processes and system upon the agent’s installation. This information will help to auto-detect and check the status of OpenStack services running on the server. Once the info is collected, Sentinel.la classify services among OpenStack projects: Nova, Neutron, Cinder, Heat, Glance, Keystone and Ceilometer.
Server View panel shows the OpenStack version running. It shows system information like processor type, memory, kernel version, storage device and capacity. You can identify the server by name and you will able to see the status (i.e. maintenance). Cloud group and location is display under the name of the server.
Note you can still have access to push notification from all your geographically distributed cloud groups at the high right corner of your console. Also, you have the option to add more servers hitting the “+ New” button next to the name of the server.
You have three buttons to change your server’s status into your overall OpenStack service:
- Toggle Maintenance Mode: Hit this button if you need to do important maintenance tasks or changes to your server (i.e. Change openstack version). Or do it before to remove it from the App (You will be able to remove the server 10min after the App stops receiving data from it). Your overall uptime will not be affected in case the server stop sending data or removal.
- Toggle Blackout Mode: Hit this button if you need to do minor changes for troubleshooting on the server. The idea is to stop sending unnecessary notifications. The server is under control and in fixing activities. Uptime indicator is still affected under this mode to estimate the impact of the current event being handled.
- Classify Server: use this button to be re-group the server into other cloud system
This view has other options to get a better insight of the services, log events and vital signs. Those can be accessed through the menu bellow the server’s description:
- Overview: This option get you back to the server´s dashboard
- Alerts: This option get you to a panel with alert’s information over the last 24 hours (The panel shows only the last 5 opened alerts). You will be able to see what alerts has been closed and ones are still opened in a chronological order
- Vital Signs: Get vital signs’ details of the server over the last 24 hours
- OpenStack Services: Get better insight of the OpenStack’s services running on the server and their heath.
- OpenStack Logs: It gets you to a panel with all the important events collected over the last 24 hours. Important events are errors, critical and warnings. This information will help you the get a better understanding of any issue and use it for troubleshooting purposes. The panel brings events in a chronological order and online search options to group events by keywords.
At the right side, you see information of the amount of the alerts are still opened, the server’s uptime and the current server’s load average over the last 24 hours.
A chart showing the amount of warnings, errors and critical events over the last 24 hours has been located under the menu options. This brings you a sample of much activity you are having into the server.
Server vita signs are also shown under the log events chart. The average of CPU, Memory and Disk utilization over the last 24 hours. Even the amount of alerts that have been closed over the last 24 hours.
Information regarding last alerts has been located next to the last panel. A column with the last 5 alerts has been posted with some details in regards to the OpenStack processes and the subject of the event that causes it.
Counters showing the current status of CPU, Memory and Disk usage is also displayed. Next to this counters, you find the “OpenStack services status” bringing a fast snap of the amount of inactive processes out of the every OpenStack’sservice in the server.


